Antisocial Activity Tracking
A GPS track provides useful a useful log of physical activities. Beyond simply recording a route, the series of coordinate and time mappings allow statistics like distance, speed, elevation, and time to be calculated. I recently decided that I wanted to start recording this information, but I was not interested in any of the plethora of social, cloud-based services that are hip these days. A simple GPX track gives me all the information I care about, and I don’t have a strong desire to share them with a third party provider or a social network.
Recording Tracks
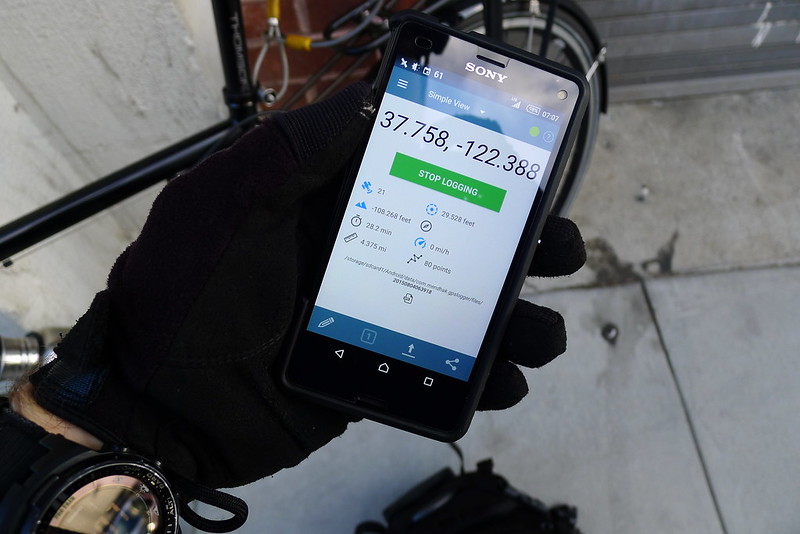
The discovery of GPSLogger is what made me excited to start this project. A simple but powerful Android application, GPSLogger will log to a number of different formats and, when a track is complete, automatically distribute it. This can be done by uploading the file to a storage provider, emailing it, or posting it to a custom URL. It always logs in metric units but optionally displays in Imperial.
What makes GPSLogger really stand out are its performance features. It allows very fine-grained control over GPS use, which allows tracks to be recorded for extended periods of times (such as days) with a negligible impact on battery usage.
For activities like running, shorter hikes and bicycle rides I tend to err on the side of accuracy. I set GPSLogger to log a coordinate every 10 seconds, with a minimum distance of 5 meters between points and a minimum accuracy of 10 meters. It will try to get a fix for 120 seconds before timing out, and attempt to meet the accuracy requirement for 60 seconds before giving up.
For a longer day-hike, the time between points could be increased to something in the neighborhood of 60 seconds. For a multi-day backpacking trip, a setting of 10 minutes or more would still provide great enough accuracy to make for a useful record of the route. I’ve found that being able to control these settings really opens up a lot of tracking possibilities that I would otherwise not consider for fear of battery drain.
Storing Tracks
After a track has been recorded, I transfer it to my computer and store it with git-annex.
Everything in my home directory that is not a temporary file is stored either in git or git-annex. By keeping my tracks in an annex rather than directly in git, I can take advantage of git-annex’s powerful metadata support. GPSLogger automatically names tracks with a time stamp, but the annex for my tracks is also configured to automatically set the year and month when adding files.
$ cd ~/tracks
$ git config annex.genmetadata true
After moving a track into the annex, I’ll tag it with a custom activity field, with values like run, hike, or bike.
$ git annex metadata --set activity=bike 20150725110839.gpx
I also find it useful to tag tracks with a gross location value so that I can get an idea of where they were recorded without loading them on a map. Counties tend to work well for this.
$ git annex metadata --set county=sanfrancisco 20150725110839.gpx
Of course, a track may span multiple counties. This is easily handled by git-annex.
$ git annex metadata --set county+=marin 20150725110839.gpx
One could also use fields to store location values such as National Park, National Forest or Wilderness Area.
Metadata Views
The reason for storing metadata is the ability to use metadata driven views. This allows me to alter the directory structure of the annex based on the metadata. For instance, I can tell git-annex to show me all tracks grouped by year followed by activity.
$ git annex view "year=*" "activity=*"
$ tree -d
.
└── 2015
    ├── bike
    ├── hike
    └── run
Or, I could ask to see all the runs I went on this July.
$ git annex view year=2015 month=07 activity=run
I’ve found this to be a super powerful tool. It gives me the simplicity and flexibility of storing the tracks as plain-text on the filesystem, with some of the querying possibilities of a database. Its usefulness is only limited by the metadata stored.
Viewing Tracks
For simple statistics, I’ll use the gpxinfo command provided by gpxpy. This gives me the basics of time, distance and speed, which is generally all I care about for something like a weekly run.
$ gpxinfo 20150725110839.gpx
File: 20150725110839.gpx
    Length 2D: 6.081km
    Length 3D: 6.123km
    Moving time: 00:35:05
    Stopped time: n/a
    Max speed: 3.54m/s = 12.74km/h
    Total uphill: 96.50m
    Total downhill: 130.50m
    Started: 2015-07-25 18:08:45
    Ended: 2015-07-25 18:43:50
    Points: 188
    Avg distance between points: 32.35m

    Track #0, Segment #0
        Length 2D: 6.081km
        Length 3D: 6.123km
        Moving time: 00:35:05
        Stopped time: n/a
        Max speed: 3.54m/s = 12.74km/h
        Total uphill: 96.50m
        Total downhill: 130.50m
        Started: 2015-07-25 18:08:45
        Ended: 2015-07-25 18:43:50
        Points: 188
        Avg distance between points: 32.35m
For a more detailed inspection of the tracks, I opt for Viking. This allows me to load the tracks and view the route on a OpenStreetMap map (or any number of other map layers, such as USGS quads or Bing aerial photography). It includes all the detailed statistics you could care about extracting from a GPX track, including pretty charts of elevation, distance, time and speed.
If I want to view the track on my phone before I’ve transferred it to my computer, I’ll load it in either BackCountry Navigator or OsmAnd, depending on what kind of map layers I am interested in seeing. For simply viewing the statistics of a track on the phone, I go with GPS Visualizer (by the same author as GPSLogger).